Its-Licious: Looking at the Data
I think one of the most interesting parts of any project is looking at the data, and seeing any interesting trends or highlights. For this project I used Google…
· 7 min read
A Post-Release analysis of mattpua.github.io/its-licious/
I think one of the most interesting parts of any project is looking at the data, and seeing any interesting trends or highlights. For this project I used **Google Analytics **to track visitor information and below are some fun highlights that I’ve extracted.
**Project Release Date: **January 19th, 2018–10am.
**Time of Writing: **January 23rd, 2018–8am.
Key Takeaways
-
95% of users were users who visited the site once and didn’t return
-
I designed it desktop first, but the majority of users viewed the site on mobile (56.77%)
-
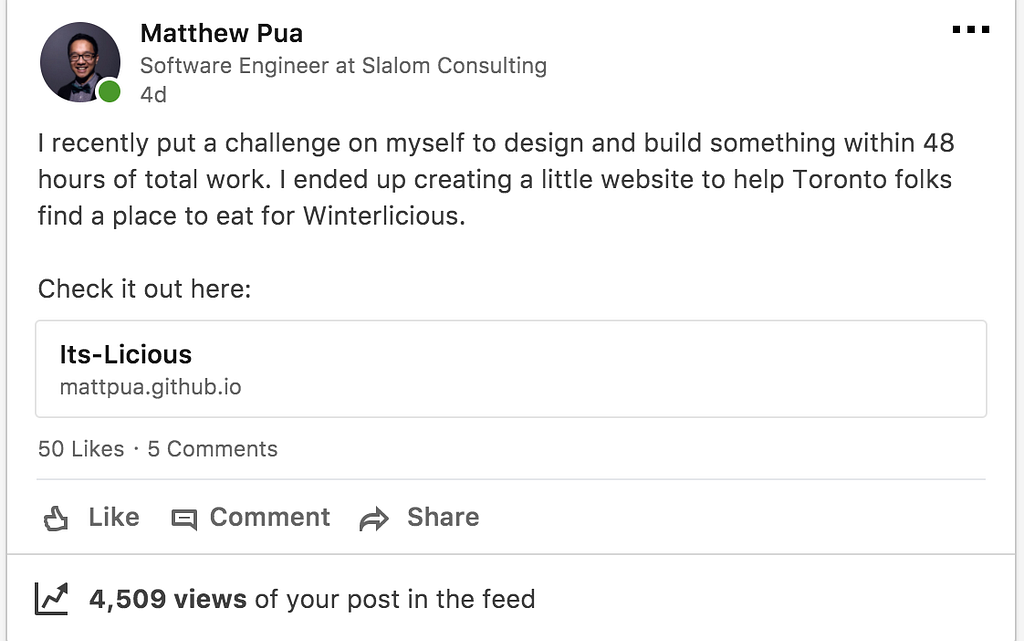
Comparing Reddit to LinkedIn, posting on Reddit which had only** 414 thread views** brought 100 new users compared to LinkedIn which only brought 122 users with over** 4,500 post impressions**
-
Posting on Facebook which can be considered the most personal social media outlet, generated the least amount of direct views relative to LinkedIn and Reddit (basically a giant group of strangers)
-
Even though the app only served a specific city (Toronto) in a specific country (Canada), 17% of users still came from outside of Canada
-
The longest time spent on the app was 13 minutes 21 seconds while the average session only lasted 30 seconds. A few individuals really spent some time diving into the app, while others mostly skimmed through it
Key Highlights
**Total Unique Users: **568
**Total Page Views: **738
**Avg Session Duration: **30 seconds
**Longest Session Duration: **13 minutes, 21 seconds
**% of Canada Based Users: **83%
**% of Mobile Users: **56.77%
**% of users from LinkedIn vs Other Social Media: **42.5%
**% of users coming from a direct link: **49.3%
**# LinkedIn Post Views: **4509
Analysis
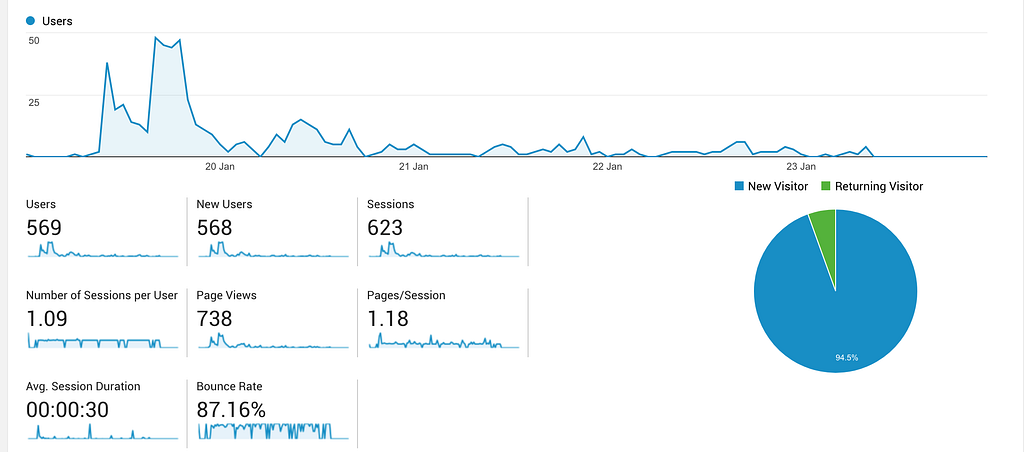
Over a 4 day period, more users came onto the site than I honestly expected (I was thinking maybe a 100 users max). On the day of release and into that evening, audience levels were at its peak. I like to think that it’s related to the fact that people get home from work, and are checking their regular use social media sites who then find this post or mention.

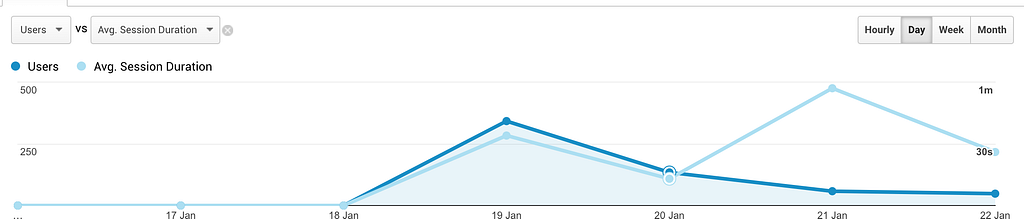
From the second day onwards, daily traffic significantly drops — on the second day, only 39% of the traffic was received relative to the first day. That trends continues onto the third and fourth day.
Interesting enough, even though the number of users decrease over the days, the average session duration increases. I like to think these individuals are the ones who really want to play with the app, and see if they can actually use it themselves for their own needs. I’d like to believe that these are really my ideal users.
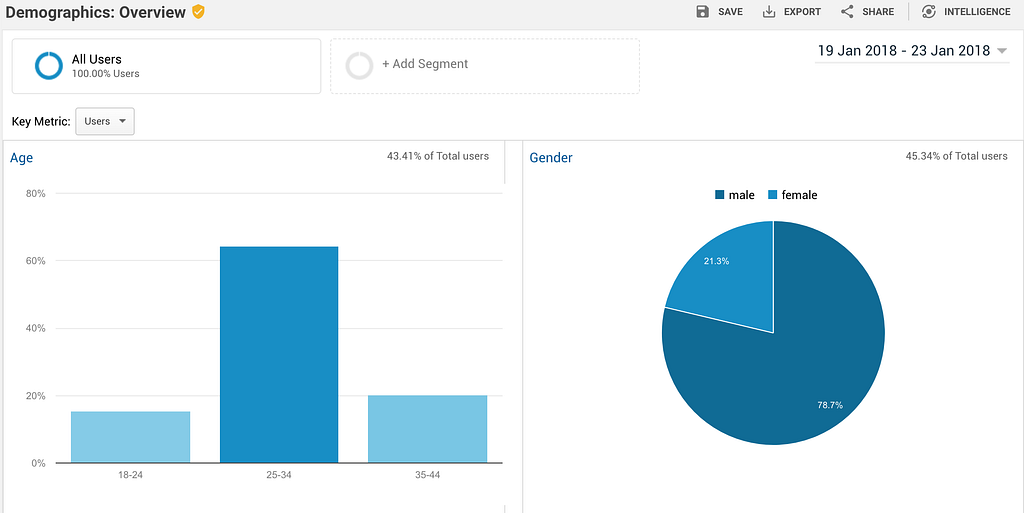
Unsurprisingly, the majority of my users were between 25–34 years old, and were male. Considering that LinkedIn was a major player in bringing me users, I believe that this represents the demographic that I’m generally connected to on LinkedIn.
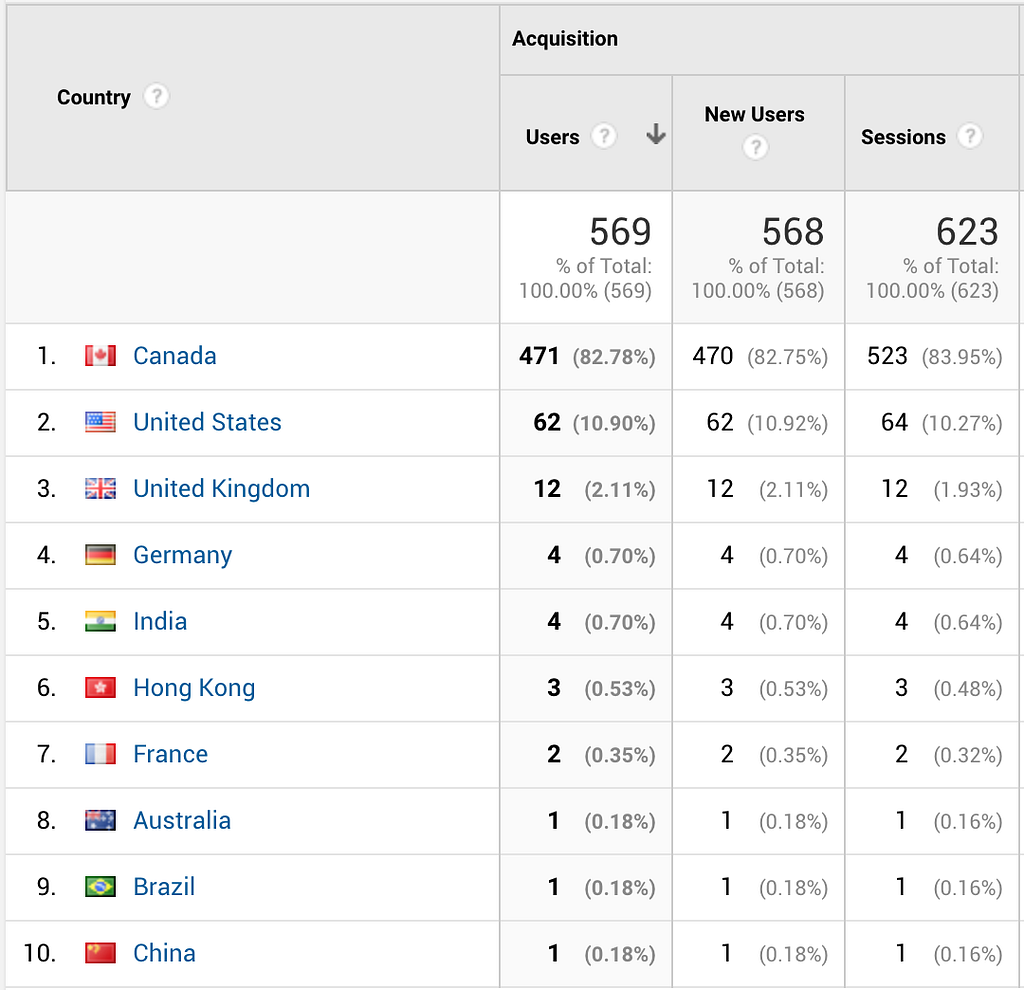
This data actually surprised me. Thinking about the fact that I was building a niche tool that only applied to a specific city in a specific country, I wasn’t really expecting to see visitors from out of country. Within my LinkedIn network, I have some connections to the US, so I can see some of the reasoning there, but it surprises me to also see traffic from the other half of the world. (How did the person in China even find this?)
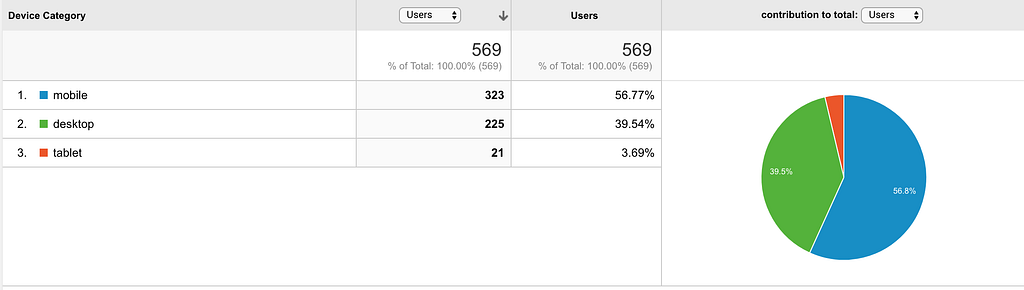
This was one of the most interesting tidbits in my opinion. When I was originally building the app, I was thinking to build it with the desktop experience first in my mind. Turns out, I should have **gone mobile first. **I think this just reinforces the notion that in today’s day and age, development needs to be done with mobile first, and then scaling up for desktop.
An ever-growing amount of users are viewing content directly from their mobile and if you want to maximize user experience and acquisition, its imperative that a great mobile experience be there alongside the desktop experience. In my case, I built it only with the desktop experience in mind, and with the mobile experience being something I put hastily together in the final sprint toward the end. Definitely something I’ll try reversing on a future project.
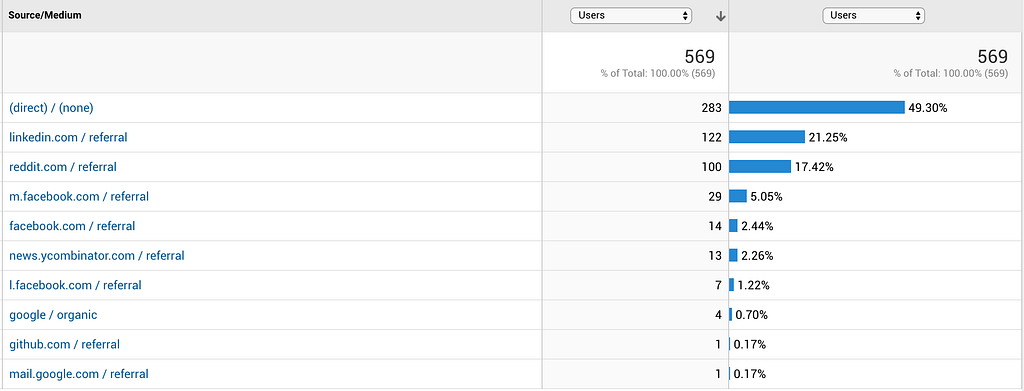
When I initially released the website, I made a very rookie mistake. I released it to all the various sites with just a unedited link to the site. It wasn’t until a day later when I was checking my analytics that I noticed it wasn’t accurately picking up my social referrals. Upon noticing that, I went back and modified the links that I posted on the various sites to append something at the end of the URL to make it easy to identify.
example: https://mattpua.github.io/its-licious/fb?
After doing this small tweak, I instantly noticed my real time analytics picking up the social links properly there. With my limited experience in Google analytics, I’m not sure if it normally would have identified traffic coming from the different sources, but this was a good fix for me that did the trick.
Some other interesting pieces of data come out from comparing the results from Reddit, and LinkedIn. I posted 4 threads in 4 subreddits which led to a total of 414 thread views, and only +17 post karma. At the time of writing, 100 users visited the site through those links. *Quick maths *again: 100 users and 414 thread views roughly equates to **1 in every 4 thread views converting to a visitor on the site. **I don’t have other data to compare it to but I think that’s a pretty good conversion rate.
But on the other hand, looking at a LinkedIn post I made on the morning I released, after 4 days I apparently had 4,509 views of the post in peoples’ feeds and 5 comments. LinkedIn apparently brought in 122 users, so that math looks like: 1 in every 45 users who saw the post actually converting to site visits.
1 in every 4 on Reddit vs 1 in every 45 on LinkedIn
Surprisingly, a smaller group of random strangers on Reddit were willing to check out the site through a post than a **significantly larger group of first and second connections **on LinkedIn. What could be the cause of this? I’d hypothesize that because you have to post in a subreddit on Reddit, the intent and focus of the post is explicit to the user when their browsing the subreddit. I posted in r/toronto, r/foodToronto, r/shamelessplug, r/sideproject. The highest traffic came from /r/toronto, and r/foodToronto. I believe that since users in the subreddit fit my target audience a lot better, they had a higher chance to click on my post and subsequently my link to see something they could relate to.
But on LinkedIn, other than my first connections, a majority of second connections may easily skim over my post in their feeds without even noticing it. This would spike up my post views, but ultimately doesn’t end in that conversion. I think an interesting test to see in the future is if posting my projects in related or somewhat related LinkedIn groups generates a higher conversion rate.
On an interesting note, releasing the project brought me a **242% increase in profile views on LinkedIn. **Takeaway? If there’s ever something you’ve added or changed on your profile and you want people to see, just release a project and the profile views will come.
Finally, one of the biggest things that I’m lacking information for is how the website performed in terms of delivering value to the user. Did many users find this site better than the original Winterlicious site? Did any users find they were able to make a better decision with the site? There’s a tonne of questions I’d like to ask and I realize that even a simple survey might have been able to provide some insight into that.
Overall, I think the release of this project was a lot more successful than I initially predicted. A lot of cool takeaways and learnings from this, and I’m excited to try another project with these learnings and see if the outcomes change.
If you enjoyed what you read, do let me know! Also if anyone is an **analytics guru, knows Google Analytics, or is knowledgeable about user acquisition, **leave a comment and let me know your thoughts!
Did I interpret the data properly?
Was there some data or stat that I should have looked at but didn’t?
Are there best times to share posts, or even what social medias are most effective at generating growth?
Leave a comment and let’s talk!
Stay tuned for other write-ups coming soon that are also related to the project such as: the design process, technology pains, and the inspiration behind it all.
12 MUST HAVE Extensions for Cursor
There’s a plethora of IDEs available to developers nowadays, and even more extensions available for those IDEs.
Its-Licious: Behind The Tech Scenes
Its-Licious was the first self timed project that I’ve ever undertaken. The goal was simple: 48 total working hours to build this idea from scratch. The time li…